Is the Market Overpriced? Using the Shiller CAPE Ratio for Long-Term Investing
Investing in the stock market often feels like navigating a stormy sea. While short-term fluctuations can be unpredictable, looking at the bigger picture can provide clarity. One powerful tool for understanding the long-term health and valuation of the market is the Shiller CAPE Ratio, also known as the Cyclically Adjusted Price-to-Earnings Ratio. This metric helps investors determine whether the market is expensive or cheap relative to historical norms, offering a grounded perspective in times of market euphoria or fear.
To understand the Shiller CAPE Ratio, we must first look at the standard P/E ratio, which divides a company’s stock price by its earnings per share. However, earnings can be volatile from year to year due to economic cycles, recessions, or one-time events. The Shiller CAPE, developed by Nobel laureate Robert Shiller, smooths out this noise. It calculates the price-to-earnings ratio using the average of a company’s inflation-adjusted earnings over the past ten years. By looking at a decade of data, the ratio filters out short-term economic bumps, providing a clearer view of a company’s or the entire market’s underlying earning power. A high CAPE ratio suggests that stocks are expensive relative to their long-term earnings, while a low ratio indicates they are cheap.
How does this influence stock market movements? 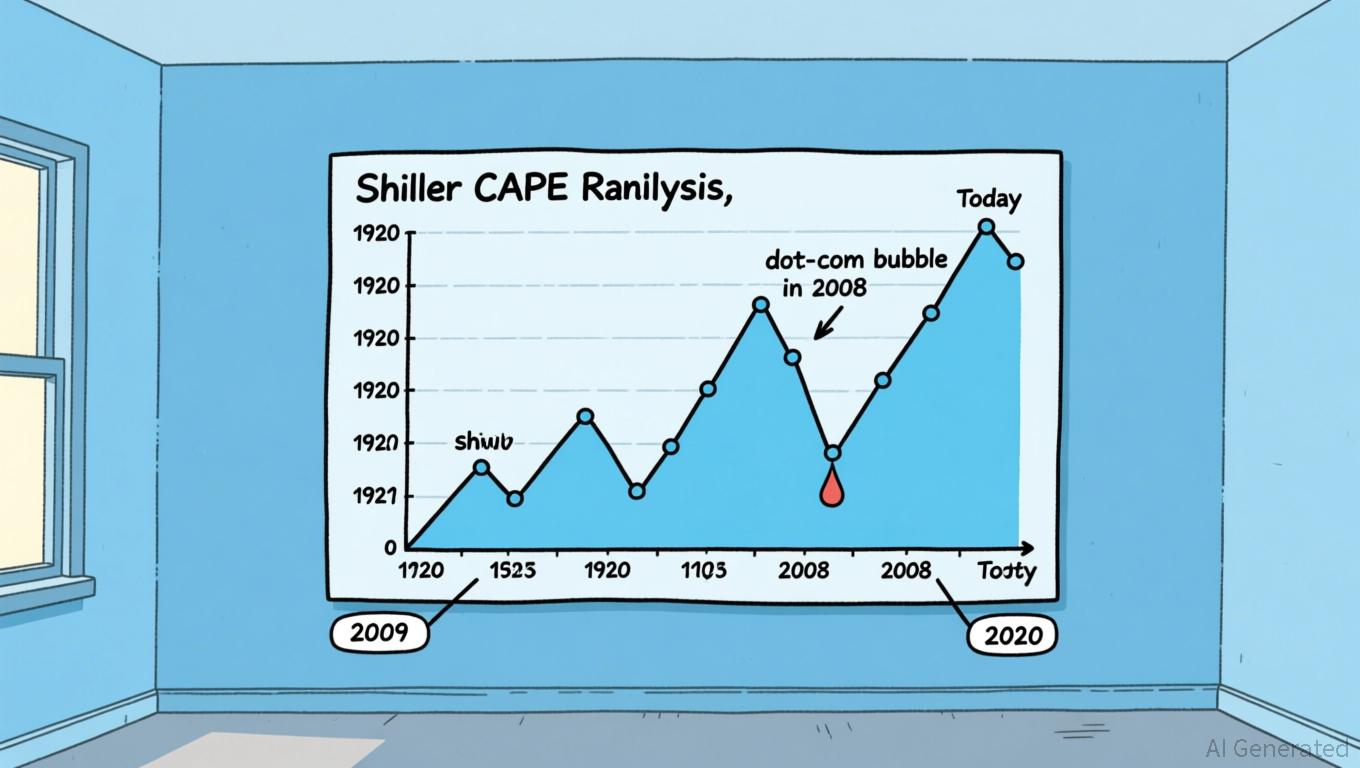 Historically, the Shiller CAPE has been a strong predictor of long-term returns. When the ratio is high, it often signals that investors are paying a premium for future growth that may not materialize, leading to lower expected returns over the next decade. Conversely, low CAPE ratios often coincide with market bottoms, offering higher potential returns for those willing to hold through volatility. Investors use this concept to adjust their asset allocation. For instance, if the CAPE is at historic highs, a conservative investor might shift more money into bonds or cash equivalents to protect capital. On the other hand, value investors might see high CAPE as a signal to be selective, picking individual stocks that are undervalued despite the broader market being expensive.
Consider the tech boom of the late 1990s. During this period, the Shiller CAPE ratio skyrocketed to nearly 45, reflecting extreme optimism about internet companies. While the market continued to rise for a short time, the subsequent dot-com crash led to significant losses for those who bought at the peak. In contrast, during the financial crisis of 2009, the CAPE dropped to around 13, signaling that stocks were historically cheap. Investors who recognized this signal and invested during that downturn reaped substantial rewards over the following decade as the market recovered. This case study illustrates that while the CAPE ratio does not predict short-term timing, it provides crucial context for long-term positioning.
However, relying solely on the Shiller CAPE ratio carries risks. The market’s structure has changed significantly since the metric was created. Today’s companies often have different cost structures, with lower capital expenditures and higher margins, which can justify higher multiples. Additionally, the ratio can remain elevated for extended periods, potentially causing investors to miss out on gains if they exit the market too early. To mitigate these risks, investors should not use the CAPE ratio in isolation. It should be part of a broader research strategy that includes analyzing individual company fundamentals, economic indicators, and personal financial goals. Diversification remains key; even if the market appears expensive, spreading investments across different asset classes can reduce overall portfolio risk.
In conclusion, the Shiller CAPE Ratio is a valuable tool for gauging long-term market valuations. By smoothing out earnings volatility, it offers a realistic view of whether stocks are priced fairly. While it is not a crystal ball for short-term movements, it serves as an essential compass for long-term investors. Understanding this metric allows you to make informed decisions, balancing optimism with caution. Remember, no single indicator tells the whole story, but combined with thorough research and disciplined risk management, the Shiller CAPE can help you navigate the complexities of the stock market with greater confidence.